MATLAB에서 최대한 표현할 수 있는 자리수는 16자리입니다.
이 이상의 자리수를 넘어 연산을 하고자할 경우에는
Symbolic Math Toolbox
를 사용하면 됩니다.

예를들어보면,

mod(2^100-1,2) 
은 0을 리턴하지만

mod(sym('2^100-1'),2)
는 1을 리턴합니다. 
Posted by leeyongwan
,

초기값

인경우


우선 2차 미분방정식을 1차로 변형합니다.

 라고 하면

 가 됩니다.

다시 정리해보면


이렇게 1차식으로 변형된 수식을 이용해서 matlab function(사용자함수)을 만듭니다.

사용자 함수를 만드는 방법은

function dy = my_fn(t,y)
dy=zeros(2,1);
dy(1)=y(2);
dy(2)=-3*y(2)-2*y(1);

이 코드를 my_fn.m으로 저장합니다. 이때 저장할 위치는 path가 지정된 곳으로 해야합니다. 보통 기본으로 저장되는 곳인 내문서/matlab은 path가 지정되어있으니 이곳에 저장해도 됩니다.


이제 커맨드 창에서 다음을 수행하면 결과를 보실수 있습니다.

[T,Y] = ode23(@my_fn,[0 12],[0 1]);
plot(T,Y(:,1))


Posted by leeyongwan
,
MATLAB에서 읽고자 하는 데이터가 화일의 부분 부분에 있을때가 있습니다. 예를 들어

Cyclic Acquisition      Time: 20.213867 Sec
Stored at:  100 cycle   Stored for:  2 segments
Points:  2
Act#3(ch#3) Segment Count Act#3(ch#3) Stroke Act#3(ch#3) Force
segments mm N
198 0.82018322 121364.52
199 0.02860938 28405.277
Cyclic Acquisition      Time: 40.164063 Sec
Stored at:  200 cycle   Stored for:  2 segments
Points:  2
Act#3(ch#3) Segment Count Act#3(ch#3) Stroke Act#3(ch#3) Force
segments mm N
398 0.81064618 120503.7
399 -0.0095387576 29093.936

이런식으로 반복되는 자료가 있는데, 이중에서 특정 포맷을 가진 숫자 데이터만 읽고 싶다면,
아래와 같이 하면 됩니다.


A=[]; %저장될 데이터 변수 초기화
fid = fopen('c:\a.dat'); %읽고자 하는 화일 열기
while 1 %화일의 마지막 줄을 읽을때 까지 반복
    tline = fgetl(fid) %화일의 한줄 내용 읽기
    if tline == -1, break, end; %화일의 마지막줄까지 읽었을때 끝내기
    tmp=sscanf(tline,'%g %g %g'); %읽은 화일을 포맷대로 배열
    if ~isempty(tmp) %제대로 배열되었다면
        A=[A;tmp']; %데이터 변수에 저장
    end
end
fclose(fid); %화일 닫기
Posted by leeyongwan
,

일반적으로 함수를 정의하는 방법은 독립적인 함수용 m화일을 생성하는 것입니다.

하지만 간단하게 스크립트 화일을 속에 함수를 정의하고 싶을때 쓸 수 있는 함수가 inline입니다.

예를 들어

g = sin(2*pi*f + theta) 인 함수를 만들고 싶다면,

>> g = inline('sin(2*pi*f + theta)')

g =

     Inline function:
     g(f,theta) = sin(2*pi*f + theta)

사용방법은 함수의 입력값으로 숫자를 대입하면 됩니다.

>> g(10,pi/6)

ans =

    0.5000

Posted by leeyongwan
,

소수/실수를 정수로 바꾸고자할때 세가지 방법이 있습니다.

반올림(round), 올림(ceil), 내림(floor)

사용방법은 간단합니다.

>> round(2.5)

ans =

     3

>> ceil(2.5)

ans =

     3

>> floor(2.5)

ans =

     2


Posted by leeyongwan
,
간단하게 어떤 함수의 그래프 모양을 보고싶을때 사용하기 편한 명령어 입니다.

예를 들어, 아래의 2차 함수의 모양을 보고싶다면

y=2*x^2+x-1

다음과같이 입력하세요.

ezplot('2*x^2+x-1-y')

사용자 삽입 이미지


범위를 지정하면 깔끔하게 볼수있겠네요.

범위지정은 다음과 같이 하면 됩니다.


ezplot('2*x^2+x-1-y', [-2 2 -2 4])
grid on

사용자 삽입 이미지

Posted by leeyongwan
,
1. m code를 작성합니다.

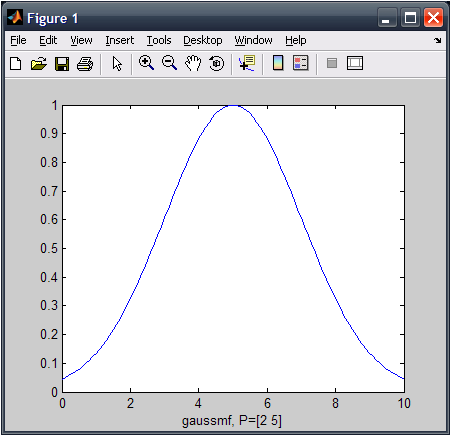
아래는 Gaussian Function의 그래프를 보는 간단한 예제 코드입니다.

function Gauss
x=0:0.1:10;
y=gaussmf(x,[2 5]);
plot(x,y)
xlabel('gaussmf, P=[2 5]')

이 코드를 Gauss.m이라는 화일명으로 저장합니다.


2. 컴파일러를 셋팅합니다.

>> mbuild -setup
Please choose your compiler for building standalone MATLAB applications:
 
Would you like mbuild to locate installed compilers [y]/n? y
 
Select a compiler:
[1] Lcc C version 2.4.1 in C:\PROGRA~1\MATLAB\R2006b\sys\lcc
[2] Microsoft Visual C/C++ version 8.0 in C:\Program Files\Microsoft Visual Studio 8
[3] Microsoft Visual C/C++ version 6.0 in C:\Program Files\Microsoft Visual Studio
 
[0] None
 
Compiler: 2 <-- 원하시는 컴파일러를 선택하시면 됩니다.
 
Please verify your choices:
 
Compiler: Microsoft Visual C/C++ 8.0
Location: C:\Program Files\Microsoft Visual Studio 8
 
Are these correct?([y]/n): y
 
****************************************************************************
  Warning: Applications/components generated using Microsoft Visual Studio  
           2005 require that the Microsoft Visual Studio 2005 run-time      
           libraries be available on the computer used for deployment.      
           To redistribute your applications/components, be sure that the   
           deployment machine has these run-time libraries. More information
           is at:                                                           
           http://www.mathworks.com/support/solutions/data/1-2223MW.html    
****************************************************************************
 
Trying to update options file: C:\Documents and Settings\Yong Lee\Application Data\MathWorks\MATLAB\R2006b\compopts.bat
From template:              C:\PROGRA~1\MATLAB\R2006b\bin\win32\mbuildopts\msvc80compp.bat
 
Done . . .
 
 
--> "C:\PROGRA~1\MATLAB\R2006b\bin\win32\mwregsvr C:\PROGRA~1\MATLAB\R2006b\bin\win32\mwcomutil.dll"
 
DllRegisterServer in C:\PROGRA~1\MATLAB\R2006b\bin\win32\mwcomutil.dll succeeded
 
--> "C:\PROGRA~1\MATLAB\R2006b\bin\win32\mwregsvr C:\PROGRA~1\MATLAB\R2006b\bin\win32\mwcommgr.dll"
 
DllRegisterServer in C:\PROGRA~1\MATLAB\R2006b\bin\win32\mwcommgr.dll succeeded
 
3. 컴파일러를 실행합니다.

mcc -m c:\Gauss.m -o Gauss

실행후 work폴더에 아래의 화일들이 생성됩니다.

Gauss.exe
Gauss.ctf

이제 Gauss.exe를 실행하시면 작성된 m 코드가 실행되는걸 보실 수 있습니다.
사용자 삽입 이미지

Posted by leeyongwan
,